Microeconomics Question from Walter E. Williams:[]
" 'Since 1900 real income has increased tremendously, yet the average number of children per family has decreased.' Consider the following possible explanations, and graphically illustrate in terms of market opportunities and indifference curves between the number of children (x) and all other goods (y). (a) Children are inferior goods; since we are richer we want fewer of them. (b) Children are not inferior goods; however, it has become more expensive to bear and raise children. (c) Children are not inferior goods, nor have they become relatively more expensive. What has happened is that tastes have changed."
Answer:[]

Inferior Good. Income rises and "other goods are preferred."
- (A) If children are inferior goods as income rises the quantity of children desired would fall. The indifference curves would have to be shaped such that, with a fixed price ratio, increases in income (shifts in the budget line) would move the representative agent into consumption of other goods (on the Y axis) and a resulting lower number of children. The new equilibrium point would be closer to the Y axis and further from the X axis (north-west). The main thrust of this story is that preferences (utility level curves) are shaped such that one good is observed as inferior.

Price change. Children (X) are relatively more expensive.
- (B) If children are more expensive over time this is a change in the price ratio. The income/children intercept of the X (children) axis rotates inward. This will constrain the new acheivable points of utility maximization. A shift out of the relatively more expensive good, children, will occur and there will be increased consumption of other goods. This also will appear as a point south-west on the graphical depiction.
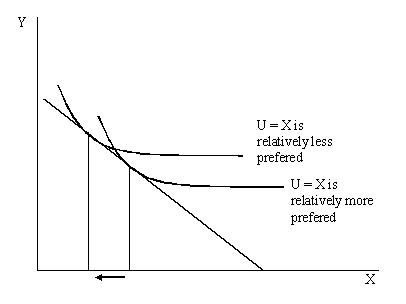
Preference Change. People in the current generation just don't like kids as much.
- (C) This final story does not need a change in income or a change in price ratios. The main thrust of this story is that the utility function (an therefore the level planes of the function) is changing. This, if drawn on one graph, will show level curves crossing one another as the representative agent maximizes with respect to bundles more north-western than whould have dominated under the old preferences.
Other Questions:[]
Next: WEW-011
Previous: WEW-009
| WEW Questions First 20 |
| WEW-001 • WEW-002 • WEW-003 • WEW-004 • WEW-005 • WEW-006 • WEW-007 • WEW-008 • WEW-009 • WEW-010 |
| WEW-011 • WEW-012 • WEW-013 • WEW-014 • WEW-015 • WEW-016 • WEW-017 • WEW-018 • WEW-019 • WEW-020
|